
What’s going on? Get the latest news and announcements about Arts and Culture programs and initiatives.
Announcements
E-News Sign Up
Sign up below for the latest news and updates!
In 2015, Arts and Culture analyzed data from 2014 reports written and submitted by grantees of the Organizational Grant Program, to identify trends in the field and to improve the program.

In 2013, 198,110 people in LA County were employed in 79 creative occupations. Half of those jobs did not require a bachelor’s degree. What kinds of careers are available, how well do they pay, and what training is required?
In 2013, the Arts Ed Collective + Arts and Culture administered a survey to arts organizations and teaching artists across the County, to find out who provided arts education services to LA County's 2,198 public schools.
This study found that arts nonprofits in LA County may be more likely than employers in other sectors to provide health benefits to their employees.
What kind of data does the Arts Commission use, and how do we use it? The LA County Arts Commission utilizes data from a variety of sources to evaluate and improve our programs and to understand the status of the local arts ecology.
This study found that bout half of all arts nonprofits in LA County had paid staff in 2011.
Analyzing data from the Cultural Data Project, Arts and Culture found that nonprofit arts organizations in Los Angeles County paid some $266.6 million in salaries to the equivalent of 4,650 full time employees in 2011.
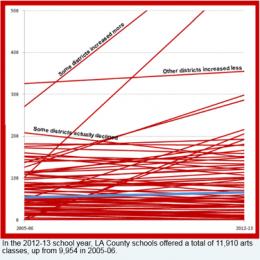
Arts education across all 81 school districts in LA County has held steady since 2005/06, despite the recession and even as the total number of students enrolled in public schools has declined. That’s what Arts and Culture learned when analyzing data on arts courses, enrollment, and teachers that was reported by school districts to the California Department of Education (CDE).